11. Results#
11.1. Load data#
Show code cell source
ecommerce_df = (
    pd.read_csv(
        "../../data/Ecommerce_orders_Data.csv",
        header=0,
        dtype={
            "ORDER_ID": np.dtype("int64"),
            "MAIN_SYSTEM_ID": np.dtype("int64"),
            "ORDER_PRICE": np.dtype("float64"),
            "DISCOUNT": np.dtype("float64"),
            "ORDER_PRICE_AFTER_DISCOUNT": np.dtype("float64"),
            "ORDER_CREATION_DATE": np.dtype("O"),
        },
    )
    .assign(
        ORDER_CREATION_DATE=lambda x: pd.to_datetime(
            x["ORDER_CREATION_DATE"], infer_datetime_format=True
        ),
    )
    .drop(["DISCOUNT", "ORDER_PRICE_AFTER_DISCOUNT"], axis=1)
    .sort_values("ORDER_CREATION_DATE")
)

ecommerce_df = (
    ecommerce_df.assign(
        ROLLINGMEAN_30DAYS__ORDER_PRICE__=(
            lambda x: x.groupby("MAIN_SYSTEM_ID")
            .rolling("30D", on="ORDER_CREATION_DATE")["ORDER_PRICE"]
            .mean()
            .reset_index(drop=True)
        ),
        ROLLINGSTDDEV_30DAYS__ORDER_PRICE__=(
            lambda x: x.groupby("MAIN_SYSTEM_ID")
            .rolling("30D", on="ORDER_CREATION_DATE")["ORDER_PRICE"]
            .std()
            .reset_index(drop=True)
        ),
    )[
        [
            "MAIN_SYSTEM_ID",
            "ORDER_CREATION_DATE",
            "ORDER_PRICE",
            "ROLLINGMEAN_30DAYS__ORDER_PRICE__",
            "ROLLINGSTDDEV_30DAYS__ORDER_PRICE__",
        ]
    ]
    .sort_values("ORDER_CREATION_DATE")
    .reset_index(drop=True)
)
ecommerce_df.info()
<class 'pandas.core.frame.DataFrame'>
RangeIndex: 656473 entries, 0 to 656472
Data columns (total 5 columns):
 #   Column                               Non-Null Count   Dtype
---  ------                               --------------   -----
 0   MAIN_SYSTEM_ID                       656473 non-null  int64
 1   ORDER_CREATION_DATE                  656473 non-null  datetime64[ns]
 2   ORDER_PRICE                          656473 non-null  float64
 3   ROLLINGMEAN_30DAYS__ORDER_PRICE__    656473 non-null  float64
 4   ROLLINGSTDDEV_30DAYS__ORDER_PRICE__  632899 non-null  float64
dtypes: datetime64[ns](1), float64(3), int64(1)
memory usage: 25.0 MB
Show code cell source
metadata_cols = ["LOAN_ID", "LOAN_ISSUANCE_DATE", "LOAN_AMOUNT"]
loans_df = (
    pd.read_excel("../../data/Loans_Data.xlsx")
    .drop(
        [
            # Low signal columns
            "INITIAL_COST",
            "INDEX",
            "REPAYMENT_ID",
            "FINAL_COST",
            "RETAILER_ID",
            # Columns populated after the fact, thus would lead to data leak
            "REPAYMENT_UPDATED",
            "SPENT",
            "TOTAL_FINAL_AMOUNT",
            "FIRST_TRIAL_BALANCE",
            "FIRST_TRAIL_DELAYS",
            "PAYMENT_AMOUNT",
            "LOAN_PAYMENT_DATE",
            "REPAYMENT_AMOUNT",
            "CUMMULATIVE_OUTSTANDING",
            "PAYMENT_STATUS",
        ],
        axis=1,
    )
    .assign(
        MAIN_SYSTEM_ID=lambda x: x["MAIN_SYSTEM_ID"].astype("int"),
        LOAN_ID=lambda x: x["LOAN_ID"].astype("int64"),
        LOAN_ISSUANCE_DATE=lambda x: x["LOAN_ISSUANCE_DATE"].astype("<M8[ns]"),
        LOAN_AMOUNT=lambda x: x["LOAN_AMOUNT"].astype("float64"),
        TOTAL_INITIAL_AMOUNT=lambda x: x["TOTAL_INITIAL_AMOUNT"].astype("float64"),
        INITIAL_DATE=lambda x: x["INITIAL_DATE"].astype("<M8[ns]"),
    )
)

test_df = pd.merge(
    loans_df[metadata_cols],
    pd.read_parquet("../../data/test/pandas-pca-featureframe-maxdepth2-targetSPENT.parquet").assign(MAIN_SYSTEM_ID=lambda x: x["MAIN_SYSTEM_ID"].astype("int")),
    on="LOAN_ID"
).drop_duplicates()

test_df.info()
<class 'pandas.core.frame.DataFrame'>
Int64Index: 56296 entries, 0 to 56295
Data columns (total 15 columns):
 #   Column                 Non-Null Count  Dtype
---  ------                 --------------  -----
 0   LOAN_ID                56296 non-null  int64
 1   LOAN_ISSUANCE_DATE     56296 non-null  datetime64[ns]
 2   LOAN_AMOUNT            56296 non-null  float64
 3   MAIN_SYSTEM_ID         56296 non-null  int64
 4   label                  56296 non-null  float64
 5   principal_component_0  56296 non-null  float64
 6   principal_component_1  56296 non-null  float64
 7   principal_component_2  56296 non-null  float64
 8   principal_component_3  56296 non-null  float64
 9   principal_component_4  56296 non-null  float64
 10  principal_component_5  56296 non-null  float64
 11  principal_component_6  56296 non-null  float64
 12  principal_component_7  56296 non-null  float64
 13  principal_component_8  56296 non-null  float64
 14  principal_component_9  56296 non-null  float64
dtypes: datetime64[ns](1), float64(12), int64(2)
memory usage: 6.9 MB
11.2. Load model and get predictions#
Show code cell source
with open("assets/sagemaker-flaml-automl-regression-maxdepth2-targetSPENT-3.pkl", "rb") as fp:
    automl: AutoML = pickle.load(fp)

test_df = test_df.assign(
    y_pred=automl.predict(test_df.drop(metadata_cols + ["MAIN_SYSTEM_ID", "label"], axis=1))
).sort_values("LOAN_ISSUANCE_DATE")
11.3. Join fields to generate final dataframe and report#
Show code cell source
merged_df = pd.merge_asof(
    test_df,
    ecommerce_df,
    left_on="LOAN_ISSUANCE_DATE",
    right_on="ORDER_CREATION_DATE",
    by="MAIN_SYSTEM_ID",
    direction="backward",
    tolerance=pd.Timedelta("7d"),
).query("LOAN_ISSUANCE_DATE > ORDER_CREATION_DATE")

merged_df.info()
<class 'pandas.core.frame.DataFrame'>
Int64Index: 34418 entries, 0 to 56293
Data columns (total 20 columns):
 #   Column                               Non-Null Count  Dtype
---  ------                               --------------  -----
 0   LOAN_ID                              34418 non-null  int64
 1   LOAN_ISSUANCE_DATE                   34418 non-null  datetime64[ns]
 2   LOAN_AMOUNT                          34418 non-null  float64
 3   MAIN_SYSTEM_ID                       34418 non-null  int64
 4   label                                34418 non-null  float64
 5   principal_component_0                34418 non-null  float64
 6   principal_component_1                34418 non-null  float64
 7   principal_component_2                34418 non-null  float64
 8   principal_component_3                34418 non-null  float64
 9   principal_component_4                34418 non-null  float64
 10  principal_component_5                34418 non-null  float64
 11  principal_component_6                34418 non-null  float64
 12  principal_component_7                34418 non-null  float64
 13  principal_component_8                34418 non-null  float64
 14  principal_component_9                34418 non-null  float64
 15  y_pred                               34418 non-null  float64
 16  ORDER_CREATION_DATE                  34418 non-null  datetime64[ns]
 17  ORDER_PRICE                          34418 non-null  float64
 18  ROLLINGMEAN_30DAYS__ORDER_PRICE__    34418 non-null  float64
 19  ROLLINGSTDDEV_30DAYS__ORDER_PRICE__  33152 non-null  float64
dtypes: datetime64[ns](2), float64(16), int64(2)
memory usage: 5.5 MB
11.4. Make decision to approve or deny loans#
CONSERVATIVE_DECISION is when:
model predicts
SPENTto be within 1 stddev of Ecommerce 30-days meanLOAN_AMOUNTdoes not exceed 1 stddev of Ecommerce 30-days mean
AMBITIOUS_DECISION is when:
model predicts
SPENTto be within 2 stddev of Ecommerce 30-days meanLOAN_AMOUNTdoes not exceed 2 stddev of Ecommerce 30-days mean
(
    merged_df.assign(
        CONSERVATIVE_DECISION=(
            (merged_df["y_pred"] <= merged_df["ROLLINGMEAN_30DAYS__ORDER_PRICE__"] + merged_df["ROLLINGSTDDEV_30DAYS__ORDER_PRICE__"])
            & (merged_df["LOAN_AMOUNT"] <= merged_df["ROLLINGMEAN_30DAYS__ORDER_PRICE__"] + merged_df["ROLLINGSTDDEV_30DAYS__ORDER_PRICE__"])
        ),
        AMBITIOUS_DECISION=(
            (merged_df["y_pred"] <= merged_df["ROLLINGMEAN_30DAYS__ORDER_PRICE__"] + 2 * merged_df["ROLLINGSTDDEV_30DAYS__ORDER_PRICE__"])
            & (merged_df["LOAN_AMOUNT"] <= merged_df["ROLLINGMEAN_30DAYS__ORDER_PRICE__"] + 2 * merged_df["ROLLINGSTDDEV_30DAYS__ORDER_PRICE__"])
        ),
    )
    [[
        "LOAN_ID",
        "CONSERVATIVE_DECISION",
        "AMBITIOUS_DECISION"
    ]]
    .to_csv("../../data/risk-assessment-decisions.csv", header=True, index=False)
)
11.5. Result Assessment#
Result assessment is based only on 34,418 observations out of the 73,086 provided, roughly the 50% latest observations – see Splitting ML dataset for more info.
Is that a problem?
There is no such thing as perfect method, but there objectively better ones. We are forced to choose where to place uncertainty:
giving models all the data, increasing chance of overfitting (models memorize the data), thus weakening confidence in results
training models in “past” data and assessing them on “future” data, reducing the signal available for models to learn, but increasing a lot confidence on results
The latter is objectively better. Think of it like this: is it better to have a funny friend that lies to you all the time, or the awkward one that is always there for you? For a party (i.e. boasting about astonishingly unrealistic performance), you want the funny friend, but what about for life?
Another point of attention is that I will consider PAYMENT_STATUS in ('Unpaid', 'Partialy paid') as defaults. I will also consider defaults all cases when the retailer is not able to make the payment on the first collection attempt. Let me explain. I understand retailers are not always to blame for missed collection attempt, it sometimes falls on our operations agents. This can definitely be addressed in the future with a separate track: optimizing ops agents schedules to maximize collection rates. However, for this case study, I’m going to limit the scope of our assessment, and my judgement is that there is also a component of timing in a retailer’s ability to repay. This shifts the objective from being “we eventually want to collect debts” to “our forecast should also optimize for timing”. Of course, this goes beyond the scope of a case study, but it is an interesting domain to explore.
With all that in mind, let’s first take a look at some broad metrics:
Show code cell source
from pyspark.sql import DataFrame, SparkSession
from pyspark.sql.functions import expr
import pyspark.sql.types as spark_dtype
import pandas as pd


# Start Spark session just because I feel more comfortable with its API rather than Pandas
spark = SparkSession.builder.getOrCreate()

# Load Decisions and Loans datasets
decision_test_observations: DataFrame = (
    spark.read.option("header", "true")
    .schema(
        spark_dtype.StructType(
            [
                spark_dtype.StructField("LOAN_ID", spark_dtype.LongType(), nullable=False),
                spark_dtype.StructField("CONSERVATIVE_DECISION", spark_dtype.BooleanType(), nullable=False),
                spark_dtype.StructField("AMBITIOUS_DECISION", spark_dtype.BooleanType(), nullable=False),
            ]
        )
    )
    .csv("../../data/risk-assessment-decisions.csv")
)
loan_metadata: DataFrame = (
    spark.createDataFrame(
        pd.read_excel("../../data/Loans_Data.xlsx")
        .drop(
            [
                # Irrelevant columns for the current assessment
                "TOTAL_INITIAL_AMOUNT", # can be inferred from other columns
                "TOTAL_FINAL_AMOUNT", # can be inferred from other columns
                "INDEX",
                "REPAYMENT_ID",
                "RETAILER_ID",
                "REPAYMENT_UPDATED",
                "PAYMENT_AMOUNT",
                "LOAN_PAYMENT_DATE",
                "REPAYMENT_AMOUNT",
                "CUMMULATIVE_OUTSTANDING",

            ],
            axis=1,
        )
        .assign(
            MAIN_SYSTEM_ID=lambda x: x["MAIN_SYSTEM_ID"].astype("int64"),
            LOAN_ID=lambda x: x["LOAN_ID"].astype("int64"),
            LOAN_ISSUANCE_DATE=lambda x: x["LOAN_ISSUANCE_DATE"].astype("<M8[ns]"),
            LOAN_DUE_DATE=lambda x: x["INITIAL_DATE"].astype("<M8[ns]"),
            # Financial info
            LOAN_AMOUNT=lambda x: x["LOAN_AMOUNT"].astype("float64"),
            INITIAL_COST=lambda x: x["INITIAL_COST"].astype("float64"),
            SPENT=lambda x: x["SPENT"].astype("float64"),
            FIRST_TRIAL_BALANCE=lambda x: x["FIRST_TRIAL_BALANCE"].astype("float64"),
            FINAL_COST=lambda x: x["FINAL_COST"].astype("float64"),
        )
    )
    .where("LOAN_ISSUANCE_DATE > '2021-12-31'")
    .join(decision_test_observations.select("LOAN_ID"), on="LOAN_ID", how="inner")
    .withColumn("LABEL", expr("(lower(PAYMENT_STATUS) != 'paid') OR (FIRST_TRIAL_BALANCE < 0)"))
    #.persist()
)

loan_metadata.selectExpr(
    # Overview
    "count(distinct LOAN_ID) as nunique_loans",
    "count(distinct date_trunc('week', LOAN_ISSUANCE_DATE)) as nunique_weeks",
    "format_string('%.2f', sum(LOAN_AMOUNT)) as total_amount_requested",
    "format_string('%.2f', sum(SPENT)) as total_amount_spent",
    "format_string('%.4f', 1 - sum(SPENT) / sum(LOAN_AMOUNT)) as percentage_amount_stale",
    # "X as total_realized_loss_first_collection",
    # Counts
    "count(distinct LOAN_ID) filter (where LABEL = false) as nunique_loans_fullfiled_first_collection",
    "count(distinct LOAN_ID) filter (where LABEL = true) as nunique_loans_defaulted_first_collection",
).show(vertical=True)
From the above summary table, we can see that we observe 371 first-collection default observations, meaning loans that were not fully repaid in first collection attempt.
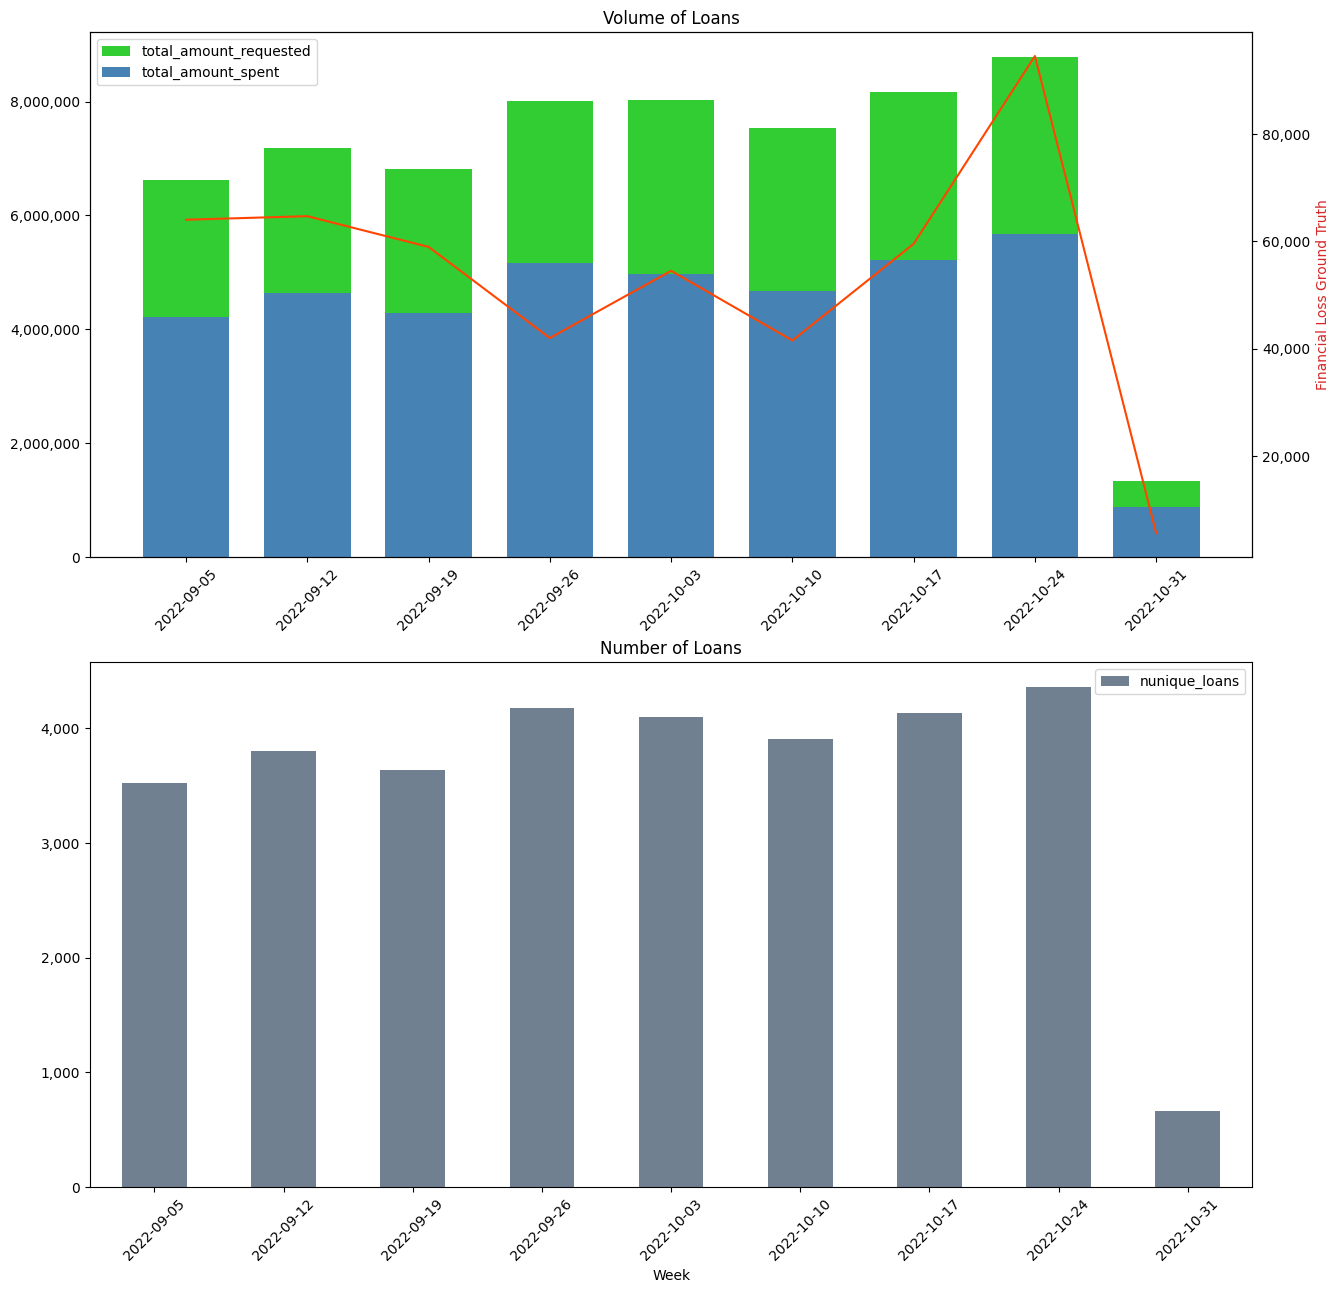
In the following plot we can see the volume of LOAN_AMOUNT (green) and SPENT (blue) over 10 weeks of testing period. The red line (right y-axis) shows the volume of failed first collection attempts that ocurred in reality. One other piece of information that becomes clear is our rate of stale capital in the difference between the green and blue bars: that gap represents money that is committed but not used, thus no fees, hence stale capital.
I also plot the count of loans over the same period on the second plot; the large drop-off in the last week of October is explained by incomplete data and can be ignored.
Show code cell source
import matplotlib.pyplot as plt
from matplotlib.ticker import FuncFormatter


wow_overview: DataFrame = (
    loan_metadata.selectExpr(
        "*",
        "date_trunc('week', LOAN_ISSUANCE_DATE) as week_dt"
    )
    .groupBy("week_dt")
    .agg(
        expr("count(distinct LOAN_ID) as nunique_loans"),
        expr("sum(LOAN_AMOUNT) as total_amount_requested"),
        expr("sum(SPENT) as total_amount_spent"),
        expr("abs(sum(FIRST_TRIAL_BALANCE) filter (where FIRST_TRIAL_BALANCE < 0)) as total_amount_loss"),
    )
    .selectExpr(
        "*",
        "nunique_loans / (lag(nunique_loans) over (order by week_dt asc))as nunique_loans_weekly_growth",
        "total_amount_requested / (lag(total_amount_requested) over (order by week_dt asc)) as total_amount_requested_weekly_growth",
        "total_amount_spent / (lag(total_amount_spent) over (order by week_dt asc)) as total_amount_spent_weekly_growth",
        "total_amount_loss / (lag(total_amount_loss) over (order by week_dt asc)) as total_amount_loss_weekly_growth",
    )
    .dropna()
    .orderBy("week_dt")
)

wow_overview.where("week_dt < '2022-10-31'").selectExpr(
    "avg(nunique_loans_weekly_growth)",
    "avg(total_amount_requested_weekly_growth)",
    "avg(total_amount_spent_weekly_growth)"
).show(1, vertical=True)

plot_data = wow_overview.toPandas().set_index("week_dt")
fig, (ax1, ax2) = plt.subplots(nrows=2, ncols=1, figsize=(15, 15))
ax1_2 = ax1.twinx()
ax1.yaxis.set_major_formatter(FuncFormatter(lambda x, _: '{:,.0f}'.format(x)))
ax1_2.yaxis.set_major_formatter(FuncFormatter(lambda x, _: '{:,.0f}'.format(x)))

ax1_2.plot(
    plot_data.index,
    plot_data["total_amount_loss"],
    color="orangered",
    label="total_amount_loss",
)
ax1.bar(
    plot_data.index,
    plot_data["total_amount_requested"],
    color="limegreen",
    label="total_amount_requested",
    width=5
)
ax1.bar(
    plot_data.index,
    plot_data["total_amount_spent"],
    color="steelblue",
    label="total_amount_spent",
    width=5
)

ax1_2.set_ylabel("Financial Loss Ground Truth",color="tab:red")
ax1.set_title("Volume of Loans")
ax1.set_xticks(plot_data.index)
ax1.set_xticklabels(plot_data.index.map(lambda x: str(x).split(" ")[0]), rotation=45)

bar3 = plot_data.plot.bar(
    ax=ax2,
    y=["nunique_loans"],
    color=["slategrey"],
)
ax2.set_xlabel('Week')
ax2.set_title("Number of Loans")
# ax2.set_xticks(plot_data.index)
ax2.set_xticklabels(plot_data.index.map(lambda x: str(x).split(" ")[0]), rotation=45)
ax2.yaxis.set_major_formatter(FuncFormatter(lambda x, _: '{:,.0f}'.format(x)))


ax1.legend()
plt.show()
23/05/08 12:58:05 WARN WindowExec: No Partition Defined for Window operation! Moving all data to a single partition, this can cause serious performance degradation.
23/05/08 12:58:05 WARN WindowExec: No Partition Defined for Window operation! Moving all data to a single partition, this can cause serious performance degradation.
23/05/08 12:58:05 WARN WindowExec: No Partition Defined for Window operation! Moving all data to a single partition, this can cause serious performance degradation.
23/05/08 12:58:05 WARN WindowExec: No Partition Defined for Window operation! Moving all data to a single partition, this can cause serious performance degradation.
23/05/08 12:58:05 WARN WindowExec: No Partition Defined for Window operation! Moving all data to a single partition, this can cause serious performance degradation.
23/05/08 12:58:05 WARN WindowExec: No Partition Defined for Window operation! Moving all data to a single partition, this can cause serious performance degradation.
23/05/08 12:58:05 WARN WindowExec: No Partition Defined for Window operation! Moving all data to a single partition, this can cause serious performance degradation.
23/05/08 12:58:05 WARN WindowExec: No Partition Defined for Window operation! Moving all data to a single partition, this can cause serious performance degradation.
23/05/08 12:58:05 WARN WindowExec: No Partition Defined for Window operation! Moving all data to a single partition, this can cause serious performance degradation.
23/05/08 12:58:05 WARN WindowExec: No Partition Defined for Window operation! Moving all data to a single partition, this can cause serious performance degradation.
-RECORD 0-------------------------------------------------------
 avg(nunique_loans_weekly_growth)          | 1.114742022449728
 avg(total_amount_requested_weekly_growth) | 1.1265760210218776
 avg(total_amount_spent_weekly_growth)     | 1.1250631960791917

23/05/08 12:58:06 WARN WindowExec: No Partition Defined for Window operation! Moving all data to a single partition, this can cause serious performance degradation.
23/05/08 12:58:06 WARN WindowExec: No Partition Defined for Window operation! Moving all data to a single partition, this can cause serious performance degradation.
23/05/08 12:58:06 WARN WindowExec: No Partition Defined for Window operation! Moving all data to a single partition, this can cause serious performance degradation.
23/05/08 12:58:06 WARN WindowExec: No Partition Defined for Window operation! Moving all data to a single partition, this can cause serious performance degradation.
23/05/08 12:58:06 WARN WindowExec: No Partition Defined for Window operation! Moving all data to a single partition, this can cause serious performance degradation.
23/05/08 12:58:06 WARN WindowExec: No Partition Defined for Window operation! Moving all data to a single partition, this can cause serious performance degradation.
23/05/08 12:58:06 WARN WindowExec: No Partition Defined for Window operation! Moving all data to a single partition, this can cause serious performance degradation.
23/05/08 12:58:06 WARN WindowExec: No Partition Defined for Window operation! Moving all data to a single partition, this can cause serious performance degradation.
23/05/08 12:58:06 WARN WindowExec: No Partition Defined for Window operation! Moving all data to a single partition, this can cause serious performance degradation.
23/05/08 12:58:06 WARN WindowExec: No Partition Defined for Window operation! Moving all data to a single partition, this can cause serious performance degradation.
Now that we understand the Ground Truth (GT), I can benchmark my 2 Credit Rules: conservative and ambitious.
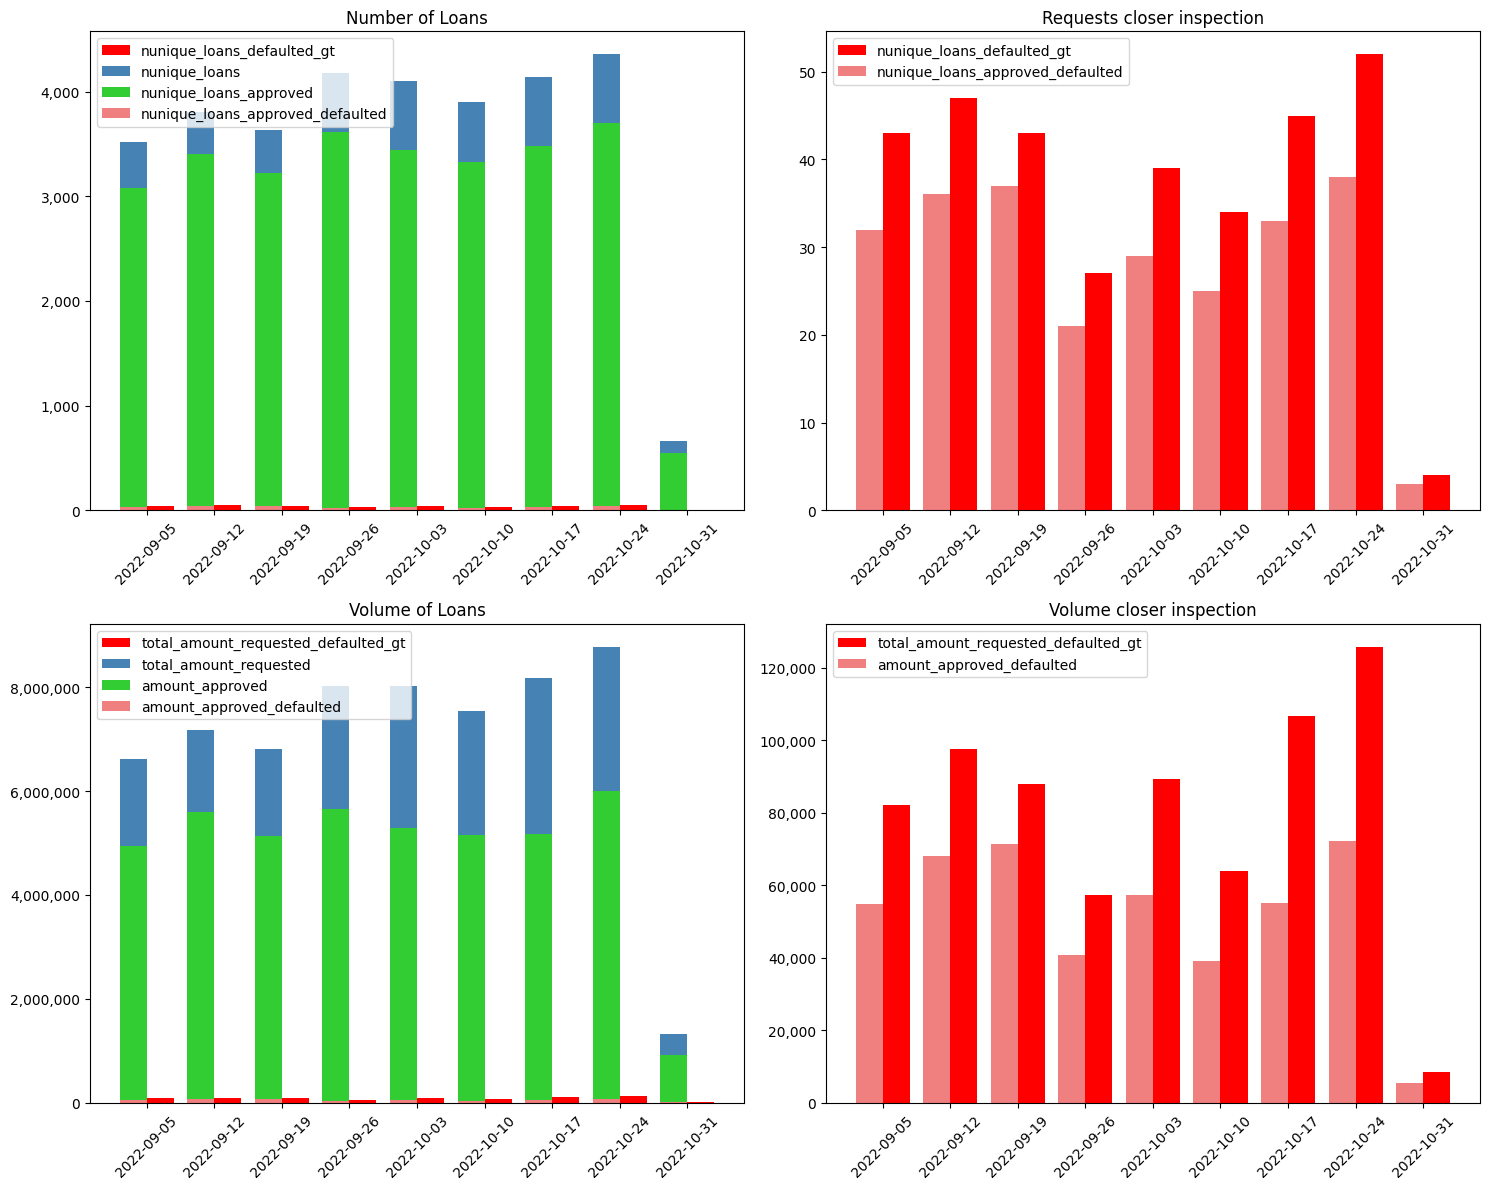
11.5.1. Conservative#
Conservative means that we are willing to approve a loan if:
Conservative means we would have:
approved X (currency) out of Y requested in total
served X out of Y retailers that requested loans
accepted exposure wow:
realized loses wow:
opportunity gap wow:
Show code cell source
import numpy as np

wow_conservative: DataFrame = (
    loan_metadata.select(
        "LOAN_ID",
        "LOAN_AMOUNT",
        "FIRST_TRIAL_BALANCE",
        "LOAN_ISSUANCE_DATE",
    )
    .join(decision_test_observations, on="LOAN_ID")
    .withColumn("week_dt", expr("date_trunc('week', LOAN_ISSUANCE_DATE)"))
    .groupBy("week_dt")
    .agg(
        expr("count(distinct LOAN_ID) as nunique_loans"),
        expr("count(distinct LOAN_ID) filter (where AMBITIOUS_DECISION = true) as nunique_loans_approved"),
        expr("count(distinct LOAN_ID) filter (where CONSERVATIVE_DECISION = true and FIRST_TRIAL_BALANCE < 0) as nunique_loans_approved_defaulted"),
        expr("count(distinct LOAN_ID) filter (where FIRST_TRIAL_BALANCE < 0) as nunique_loans_defaulted_gt"),
        # Volume
        expr("sum(LOAN_AMOUNT) as total_amount_requested"),
        expr("sum(LOAN_AMOUNT) filter (where CONSERVATIVE_DECISION = true) as amount_approved"),
        expr("sum(LOAN_AMOUNT) filter (where CONSERVATIVE_DECISION = true and FIRST_TRIAL_BALANCE < 0) as amount_approved_defaulted"),
        expr("sum(LOAN_AMOUNT) filter (where FIRST_TRIAL_BALANCE < 0) as total_amount_requested_defaulted_gt"),
        # expr("sum(SPENT) as total_amount_spent"),
        # expr("abs(sum(FIRST_TRIAL_BALANCE) filter (where FIRST_TRIAL_BALANCE < 0)) as total_amount_loss"),
    )
    .selectExpr(
        "*",
        "nunique_loans_approved / (lag(nunique_loans_approved) over (order by week_dt asc))as nunique_loans_approved_weekly_growth",
        "nunique_loans_approved_defaulted / (lag(nunique_loans_approved_defaulted) over (order by week_dt asc))as nunique_loans_approved_defaulted_weekly_growth",
        # "total_amount_requested / (lag(total_amount_requested) over (order by week_dt asc)) as total_amount_requested_weekly_growth",
        # "total_amount_spent / (lag(total_amount_spent) over (order by week_dt asc)) as total_amount_spent_weekly_growth",
        # "total_amount_loss / (lag(total_amount_loss) over (order by week_dt asc)) as total_amount_loss_weekly_growth",
    )
    .dropna()
    .orderBy("week_dt")
)

wow_conservative.where("week_dt < '2022-10-31'").selectExpr(
    "avg(nunique_loans_approved_weekly_growth)",
    "avg(nunique_loans_approved_defaulted_weekly_growth)",
).show(1, vertical=True)

conservative_plot_data = wow_conservative.toPandas().set_index("week_dt")
fig, ((ax1, ax2), (ax3, ax4)) = plt.subplots(nrows=2, ncols=2, figsize=(15, 12))
bar_width = .4
x_values = np.arange(len(conservative_plot_data.index))

ax1.bar(
    # conservative_plot_data.index,
    x_values + bar_width / 2,
    conservative_plot_data["nunique_loans_defaulted_gt"].values,
    color="red",
    label="nunique_loans_defaulted_gt",
    width=bar_width
)
ax1.bar(
    # conservative_plot_data.index,
    x_values - bar_width / 2,
    conservative_plot_data["nunique_loans"].values,
    color="steelblue",
    label="nunique_loans",
    width=bar_width
)
ax1.bar(
    # conservative_plot_data.index,
    x_values - bar_width / 2,
    conservative_plot_data["nunique_loans_approved"].values,
    color="limegreen",
    label="nunique_loans_approved",
    width=bar_width
)
ax1.bar(
    # conservative_plot_data.index,
    x_values - bar_width / 2,
    conservative_plot_data["nunique_loans_approved_defaulted"].values,
    color="lightcoral",
    label="nunique_loans_approved_defaulted",
    width=bar_width
)

ax1.set_title("Number of Loans")
ax1.set_xticks(x_values)
ax1.set_xticklabels(conservative_plot_data.index.map(lambda x: str(x).split(" ")[0]), rotation=45)
ax1.yaxis.set_major_formatter(FuncFormatter(lambda x, _: '{:,.0f}'.format(x)))
ax1.legend()

ax2.bar(
    # conservative_plot_data.index,
    x_values + bar_width / 2,
    conservative_plot_data["nunique_loans_defaulted_gt"].values,
    color="red",
    label="nunique_loans_defaulted_gt",
    width=bar_width
)
ax2.bar(
    # conservative_plot_data.index,
    x_values - bar_width / 2,
    conservative_plot_data["nunique_loans_approved_defaulted"].values,
    color="lightcoral",
    label="nunique_loans_approved_defaulted",
    width=bar_width
)

ax2.set_title("Requests closer inspection")
ax2.set_xticks(x_values)
ax2.set_xticklabels(conservative_plot_data.index.map(lambda x: str(x).split(" ")[0]), rotation=45)
ax2.legend()

ax3.bar(
    # conservative_plot_data.index,
    x_values + bar_width / 2,
    conservative_plot_data["total_amount_requested_defaulted_gt"].values,
    color="red",
    label="total_amount_requested_defaulted_gt",
    width=bar_width
)
ax3.bar(
    # conservative_plot_data.index,
    x_values - bar_width / 2,
    conservative_plot_data["total_amount_requested"].values,
    color="steelblue",
    label="total_amount_requested",
    width=bar_width
)
ax3.bar(
    # conservative_plot_data.index,
    x_values - bar_width / 2,
    conservative_plot_data["amount_approved"].values,
    color="limegreen",
    label="amount_approved",
    width=bar_width
)
ax3.bar(
    # conservative_plot_data.index,
    x_values - bar_width / 2,
    conservative_plot_data["amount_approved_defaulted"].values,
    color="lightcoral",
    label="amount_approved_defaulted",
    width=bar_width
)

ax3.set_title("Volume of Loans")
ax3.set_xticks(x_values)
ax3.set_xticklabels(conservative_plot_data.index.map(lambda x: str(x).split(" ")[0]), rotation=45)
ax3.yaxis.set_major_formatter(FuncFormatter(lambda x, _: '{:,.0f}'.format(x)))
ax3.legend()

ax4.bar(
    # conservative_plot_data.index,
    x_values + bar_width / 2,
    conservative_plot_data["total_amount_requested_defaulted_gt"].values,
    color="red",
    label="total_amount_requested_defaulted_gt",
    width=bar_width
)
ax4.bar(
    # conservative_plot_data.index,
    x_values - bar_width / 2,
    conservative_plot_data["amount_approved_defaulted"].values,
    color="lightcoral",
    label="amount_approved_defaulted",
    width=bar_width
)

ax4.set_title("Volume closer inspection")
ax4.set_xticks(x_values)
ax4.yaxis.set_major_formatter(FuncFormatter(lambda x, _: '{:,.0f}'.format(x)))
ax4.set_xticklabels(conservative_plot_data.index.map(lambda x: str(x).split(" ")[0]), rotation=45)
ax4.legend()

plt.tight_layout()
plt.show()
23/05/08 12:58:07 WARN WindowExec: No Partition Defined for Window operation! Moving all data to a single partition, this can cause serious performance degradation.
23/05/08 12:58:07 WARN WindowExec: No Partition Defined for Window operation! Moving all data to a single partition, this can cause serious performance degradation.
23/05/08 12:58:07 WARN WindowExec: No Partition Defined for Window operation! Moving all data to a single partition, this can cause serious performance degradation.
23/05/08 12:58:07 WARN WindowExec: No Partition Defined for Window operation! Moving all data to a single partition, this can cause serious performance degradation.
23/05/08 12:58:07 WARN WindowExec: No Partition Defined for Window operation! Moving all data to a single partition, this can cause serious performance degradation.
23/05/08 12:58:07 WARN WindowExec: No Partition Defined for Window operation! Moving all data to a single partition, this can cause serious performance degradation.
23/05/08 12:58:07 WARN WindowExec: No Partition Defined for Window operation! Moving all data to a single partition, this can cause serious performance degradation.
23/05/08 12:58:07 WARN WindowExec: No Partition Defined for Window operation! Moving all data to a single partition, this can cause serious performance degradation.
23/05/08 12:58:08 WARN WindowExec: No Partition Defined for Window operation! Moving all data to a single partition, this can cause serious performance degradation.
23/05/08 12:58:08 WARN WindowExec: No Partition Defined for Window operation! Moving all data to a single partition, this can cause serious performance degradation.
23/05/08 12:58:08 WARN WindowExec: No Partition Defined for Window operation! Moving all data to a single partition, this can cause serious performance degradation.
23/05/08 12:58:08 WARN WindowExec: No Partition Defined for Window operation! Moving all data to a single partition, this can cause serious performance degradation.
23/05/08 12:58:08 WARN WindowExec: No Partition Defined for Window operation! Moving all data to a single partition, this can cause serious performance degradation.
23/05/08 12:58:08 WARN WindowExec: No Partition Defined for Window operation! Moving all data to a single partition, this can cause serious performance degradation.
-RECORD 0-----------------------------------------------------------------
 avg(nunique_loans_approved_weekly_growth)           | 1.1077757861859945
 avg(nunique_loans_approved_defaulted_weekly_growth) | 1.0470072892397944
23/05/08 12:58:08 WARN WindowExec: No Partition Defined for Window operation! Moving all data to a single partition, this can cause serious performance degradation.
23/05/08 12:58:08 WARN WindowExec: No Partition Defined for Window operation! Moving all data to a single partition, this can cause serious performance degradation.
23/05/08 12:58:08 WARN WindowExec: No Partition Defined for Window operation! Moving all data to a single partition, this can cause serious performance degradation.
23/05/08 12:58:08 WARN WindowExec: No Partition Defined for Window operation! Moving all data to a single partition, this can cause serious performance degradation.
23/05/08 12:58:08 WARN WindowExec: No Partition Defined for Window operation! Moving all data to a single partition, this can cause serious performance degradation.
23/05/08 12:58:08 WARN WindowExec: No Partition Defined for Window operation! Moving all data to a single partition, this can cause serious performance degradation.
23/05/08 12:58:08 WARN WindowExec: No Partition Defined for Window operation! Moving all data to a single partition, this can cause serious performance degradation.
23/05/08 12:58:08 WARN WindowExec: No Partition Defined for Window operation! Moving all data to a single partition, this can cause serious performance degradation.
23/05/08 12:58:08 WARN WindowExec: No Partition Defined for Window operation! Moving all data to a single partition, this can cause serious performance degradation.
23/05/08 12:58:08 WARN WindowExec: No Partition Defined for Window operation! Moving all data to a single partition, this can cause serious performance degradation.
23/05/08 12:58:09 WARN WindowExec: No Partition Defined for Window operation! Moving all data to a single partition, this can cause serious performance degradation.
23/05/08 12:58:09 WARN WindowExec: No Partition Defined for Window operation! Moving all data to a single partition, this can cause serious performance degradation.
23/05/08 12:58:09 WARN WindowExec: No Partition Defined for Window operation! Moving all data to a single partition, this can cause serious performance degradation.
23/05/08 12:58:09 WARN WindowExec: No Partition Defined for Window operation! Moving all data to a single partition, this can cause serious performance degradation.
[WIP] Ideas, definitely no time to cover all – choose a couple:
daily rate of exposure (need to define exposure precisely, maybe stddev above 30-day mean predicted volume)
weekly rate of exposure vs. realized loss
recommend daily interest rates based to cover previous week exposure (if time allows, account for seasonality)
daily rate of stale capital: LOAN_AMOUNT vs. SPENT
weekly projected growth vs. realized growth
11.5.2. Ambitious#
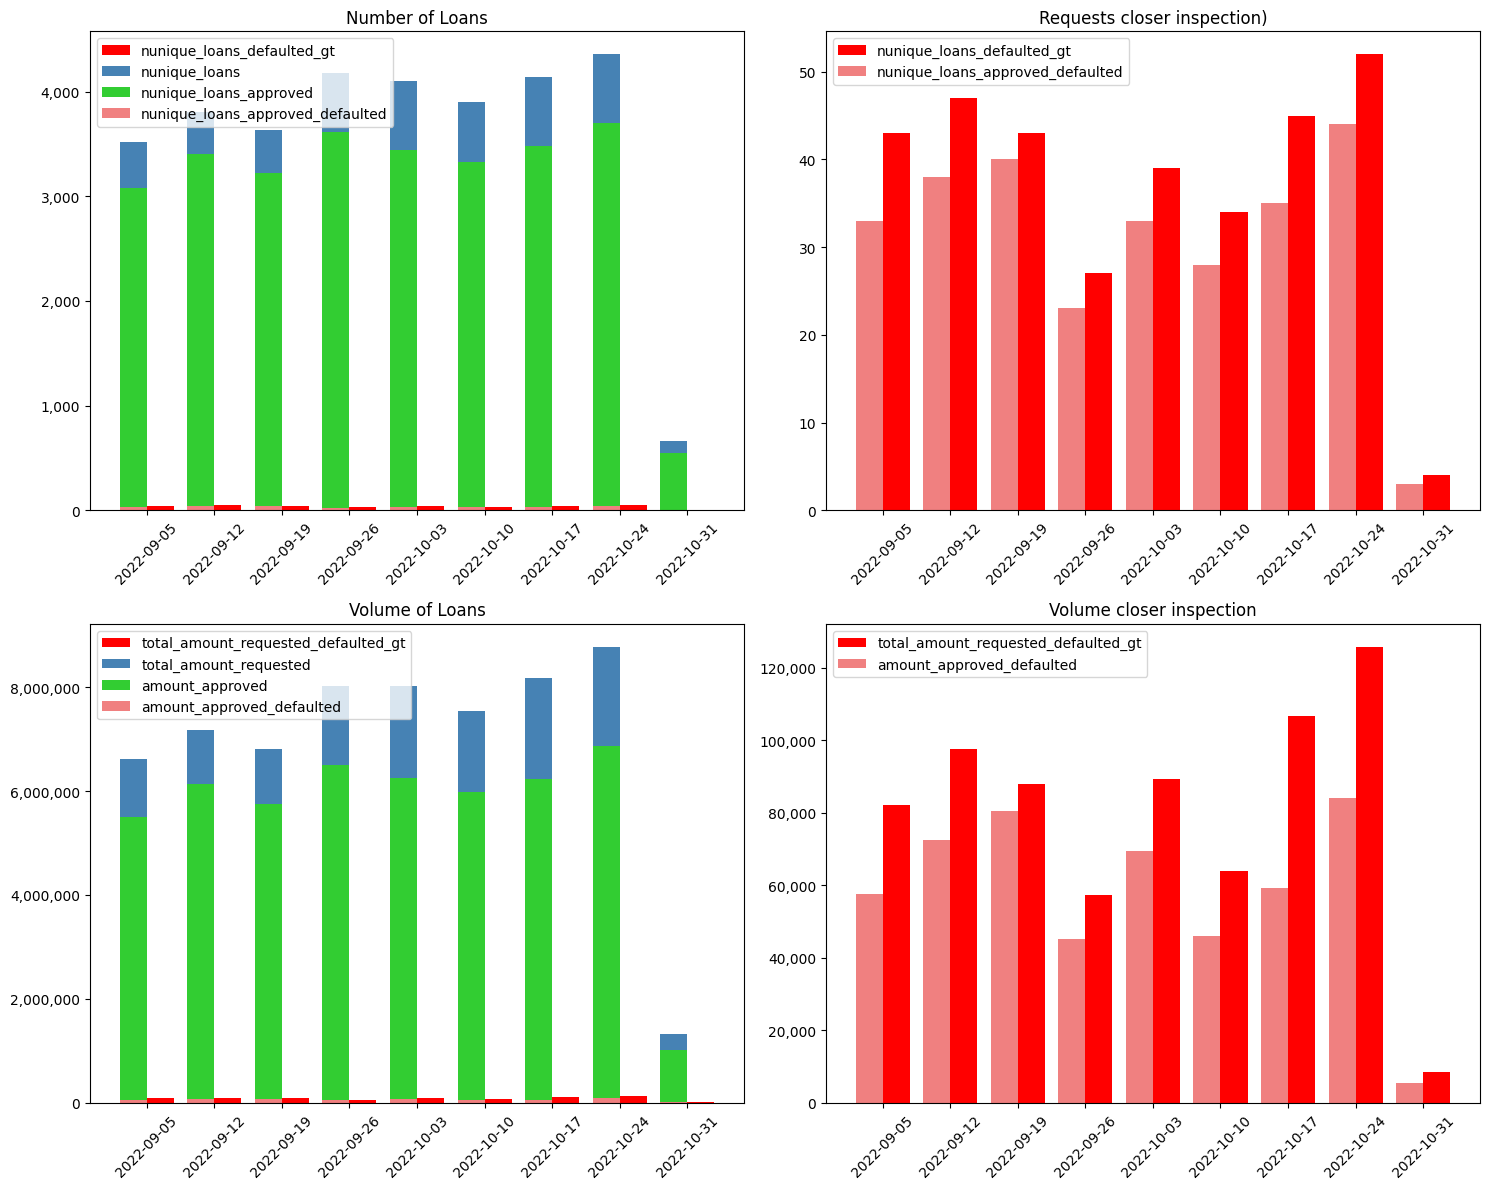
Ambitious means that we are willing to approve a loan if the same formula above applies but with \(2 * standard\_deviation_{30days}\), higher multiplier for standard deviation upper bound.
By choosing to be ambitious, we are willing to provide loans to 13.6% more retailers, knowing these to be leverage-seekers. As mentioned before, hedging against financial loss via product pricing is a very important topic, but goes beyond the scope of this case study. However, just as food-for-thought, here are some parameters that have to be considered and others that can be adjusted:
the current available lending pool volume
the current exposure and coverage on volume already approved for lending in the period (e.g. daily)
if current
volume_lentis made up mostly of conservative loans, we can be more ambitious until we reach our financial exposure threshold, or are no longer interested in adding overhead to pricing for non-financial reasons (e.g. bad press on high rates – “abusive rates” is clickbait headline that unfortunately sells)
our assumed percent rate of
default_volume: nob adjusted based onstandard_deviationmultiplierour
margin_multiplier: nob adjusted based on growth vs. profit appetite
These are just a few parameters that we could observe and manipulate to keep operations healthy while keeping financial exposure under control. There is so much more to explore, this is indeed very exciting.
Finally, ambitious means we would have:
approved X (currency) out of Y requested in total
served X out of Y retailers that requested loans
accepted exposure wow:
realized loses wow:
opportunity gap wow:
Show code cell source
import numpy as np

wow_ambitious: DataFrame = (
    loan_metadata.select(
        "LOAN_ID",
        "LOAN_AMOUNT",
        "FIRST_TRIAL_BALANCE",
        "LOAN_ISSUANCE_DATE",
    )
    .join(decision_test_observations, on="LOAN_ID")
    .withColumn("week_dt", expr("date_trunc('week', LOAN_ISSUANCE_DATE)"))
    .groupBy("week_dt")
    .agg(
        expr("count(distinct LOAN_ID) as nunique_loans"),
        expr("count(distinct LOAN_ID) filter (where AMBITIOUS_DECISION = true) as nunique_loans_approved"),
        expr("count(distinct LOAN_ID) filter (where AMBITIOUS_DECISION = true and FIRST_TRIAL_BALANCE < 0) as nunique_loans_approved_defaulted"),
        expr("count(distinct LOAN_ID) filter (where FIRST_TRIAL_BALANCE < 0) as nunique_loans_defaulted_gt"),
        # Volume
        expr("sum(LOAN_AMOUNT) as total_amount_requested"),
        expr("sum(LOAN_AMOUNT) filter (where AMBITIOUS_DECISION = true) as amount_approved"),
        expr("sum(LOAN_AMOUNT) filter (where AMBITIOUS_DECISION = true and FIRST_TRIAL_BALANCE < 0) as amount_approved_defaulted"),
        expr("sum(LOAN_AMOUNT) filter (where FIRST_TRIAL_BALANCE < 0) as total_amount_requested_defaulted_gt"),
        # expr("sum(SPENT) as total_amount_spent"),
        # expr("abs(sum(FIRST_TRIAL_BALANCE) filter (where FIRST_TRIAL_BALANCE < 0)) as total_amount_loss"),
    )
    .selectExpr(
        "*",
        "nunique_loans_approved / (lag(nunique_loans_approved) over (order by week_dt asc))as nunique_loans_approved_weekly_growth",
        "nunique_loans_approved_defaulted / (lag(nunique_loans_approved_defaulted) over (order by week_dt asc))as nunique_loans_approved_defaulted_weekly_growth",
        # "total_amount_requested / (lag(total_amount_requested) over (order by week_dt asc)) as total_amount_requested_weekly_growth",
        # "total_amount_spent / (lag(total_amount_spent) over (order by week_dt asc)) as total_amount_spent_weekly_growth",
        # "total_amount_loss / (lag(total_amount_loss) over (order by week_dt asc)) as total_amount_loss_weekly_growth",
    )
    .dropna()
    .orderBy("week_dt")
)

wow_ambitious.where("week_dt < '2022-10-31'").selectExpr(
    "avg(nunique_loans_approved_weekly_growth)",
    "avg(nunique_loans_approved_defaulted_weekly_growth)",
).show(1, vertical=True)

ambitious_plot_data = wow_ambitious.toPandas().set_index("week_dt")
fig, ((ax1, ax2), (ax3, ax4)) = plt.subplots(nrows=2, ncols=2, figsize=(15, 12))
bar_width = .4
x_values = np.arange(len(ambitious_plot_data.index))

ax1.bar(
    # ambitious_plot_data.index,
    x_values + bar_width / 2,
    ambitious_plot_data["nunique_loans_defaulted_gt"].values,
    color="red",
    label="nunique_loans_defaulted_gt",
    width=bar_width
)
ax1.bar(
    # ambitious_plot_data.index,
    x_values - bar_width / 2,
    ambitious_plot_data["nunique_loans"].values,
    color="steelblue",
    label="nunique_loans",
    width=bar_width
)
ax1.bar(
    # ambitious_plot_data.index,
    x_values - bar_width / 2,
    ambitious_plot_data["nunique_loans_approved"].values,
    color="limegreen",
    label="nunique_loans_approved",
    width=bar_width
)
ax1.bar(
    # ambitious_plot_data.index,
    x_values - bar_width / 2,
    ambitious_plot_data["nunique_loans_approved_defaulted"].values,
    color="lightcoral",
    label="nunique_loans_approved_defaulted",
    width=bar_width
)

ax1.set_title("Number of Loans")
ax1.set_xticks(x_values)
ax1.set_xticklabels(ambitious_plot_data.index.map(lambda x: str(x).split(" ")[0]), rotation=45)
ax1.yaxis.set_major_formatter(FuncFormatter(lambda x, _: '{:,.0f}'.format(x)))
ax1.legend()

ax2.bar(
    # ambitious_plot_data.index,
    x_values + bar_width / 2,
    ambitious_plot_data["nunique_loans_defaulted_gt"].values,
    color="red",
    label="nunique_loans_defaulted_gt",
    width=bar_width
)
ax2.bar(
    # ambitious_plot_data.index,
    x_values - bar_width / 2,
    ambitious_plot_data["nunique_loans_approved_defaulted"].values,
    color="lightcoral",
    label="nunique_loans_approved_defaulted",
    width=bar_width
)

ax2.set_title("Requests closer inspection)")
ax2.set_xticks(x_values)
ax2.set_xticklabels(ambitious_plot_data.index.map(lambda x: str(x).split(" ")[0]), rotation=45)
ax2.legend()

ax3.bar(
    # ambitious_plot_data.index,
    x_values + bar_width / 2,
    ambitious_plot_data["total_amount_requested_defaulted_gt"].values,
    color="red",
    label="total_amount_requested_defaulted_gt",
    width=bar_width
)
ax3.bar(
    # ambitious_plot_data.index,
    x_values - bar_width / 2,
    ambitious_plot_data["total_amount_requested"].values,
    color="steelblue",
    label="total_amount_requested",
    width=bar_width
)
ax3.bar(
    # ambitious_plot_data.index,
    x_values - bar_width / 2,
    ambitious_plot_data["amount_approved"].values,
    color="limegreen",
    label="amount_approved",
    width=bar_width
)
ax3.bar(
    # ambitious_plot_data.index,
    x_values - bar_width / 2,
    ambitious_plot_data["amount_approved_defaulted"].values,
    color="lightcoral",
    label="amount_approved_defaulted",
    width=bar_width
)

ax3.set_title("Volume of Loans")
ax3.set_xticks(x_values)
ax3.set_xticklabels(ambitious_plot_data.index.map(lambda x: str(x).split(" ")[0]), rotation=45)
ax3.yaxis.set_major_formatter(FuncFormatter(lambda x, _: '{:,.0f}'.format(x)))
ax3.legend()

ax4.bar(
    # ambitious_plot_data.index,
    x_values + bar_width / 2,
    ambitious_plot_data["total_amount_requested_defaulted_gt"].values,
    color="red",
    label="total_amount_requested_defaulted_gt",
    width=bar_width
)
ax4.bar(
    # ambitious_plot_data.index,
    x_values - bar_width / 2,
    ambitious_plot_data["amount_approved_defaulted"].values,
    color="lightcoral",
    label="amount_approved_defaulted",
    width=bar_width
)

ax4.set_title("Volume closer inspection")
ax4.set_xticks(x_values)
ax4.yaxis.set_major_formatter(FuncFormatter(lambda x, _: '{:,.0f}'.format(x)))
ax4.set_xticklabels(ambitious_plot_data.index.map(lambda x: str(x).split(" ")[0]), rotation=45)
ax4.legend()

plt.tight_layout()
plt.show()
23/05/08 12:58:10 WARN WindowExec: No Partition Defined for Window operation! Moving all data to a single partition, this can cause serious performance degradation.
23/05/08 12:58:10 WARN WindowExec: No Partition Defined for Window operation! Moving all data to a single partition, this can cause serious performance degradation.
23/05/08 12:58:10 WARN WindowExec: No Partition Defined for Window operation! Moving all data to a single partition, this can cause serious performance degradation.
23/05/08 12:58:10 WARN WindowExec: No Partition Defined for Window operation! Moving all data to a single partition, this can cause serious performance degradation.
23/05/08 12:58:10 WARN WindowExec: No Partition Defined for Window operation! Moving all data to a single partition, this can cause serious performance degradation.
23/05/08 12:58:10 WARN WindowExec: No Partition Defined for Window operation! Moving all data to a single partition, this can cause serious performance degradation.
23/05/08 12:58:10 WARN WindowExec: No Partition Defined for Window operation! Moving all data to a single partition, this can cause serious performance degradation.
23/05/08 12:58:10 WARN WindowExec: No Partition Defined for Window operation! Moving all data to a single partition, this can cause serious performance degradation.
23/05/08 12:58:10 WARN WindowExec: No Partition Defined for Window operation! Moving all data to a single partition, this can cause serious performance degradation.
23/05/08 12:58:10 WARN WindowExec: No Partition Defined for Window operation! Moving all data to a single partition, this can cause serious performance degradation.
23/05/08 12:58:10 WARN WindowExec: No Partition Defined for Window operation! Moving all data to a single partition, this can cause serious performance degradation.
23/05/08 12:58:10 WARN WindowExec: No Partition Defined for Window operation! Moving all data to a single partition, this can cause serious performance degradation.
23/05/08 12:58:10 WARN WindowExec: No Partition Defined for Window operation! Moving all data to a single partition, this can cause serious performance degradation.
23/05/08 12:58:10 WARN WindowExec: No Partition Defined for Window operation! Moving all data to a single partition, this can cause serious performance degradation.
-RECORD 0-----------------------------------------------------------------
 avg(nunique_loans_approved_weekly_growth)           | 1.1077757861859945
 avg(nunique_loans_approved_defaulted_weekly_growth) | 1.0640517734553776
23/05/08 12:58:10 WARN WindowExec: No Partition Defined for Window operation! Moving all data to a single partition, this can cause serious performance degradation.
23/05/08 12:58:10 WARN WindowExec: No Partition Defined for Window operation! Moving all data to a single partition, this can cause serious performance degradation.
23/05/08 12:58:10 WARN WindowExec: No Partition Defined for Window operation! Moving all data to a single partition, this can cause serious performance degradation.
23/05/08 12:58:10 WARN WindowExec: No Partition Defined for Window operation! Moving all data to a single partition, this can cause serious performance degradation.
23/05/08 12:58:10 WARN WindowExec: No Partition Defined for Window operation! Moving all data to a single partition, this can cause serious performance degradation.
23/05/08 12:58:10 WARN WindowExec: No Partition Defined for Window operation! Moving all data to a single partition, this can cause serious performance degradation.
23/05/08 12:58:10 WARN WindowExec: No Partition Defined for Window operation! Moving all data to a single partition, this can cause serious performance degradation.
23/05/08 12:58:10 WARN WindowExec: No Partition Defined for Window operation! Moving all data to a single partition, this can cause serious performance degradation.
23/05/08 12:58:11 WARN WindowExec: No Partition Defined for Window operation! Moving all data to a single partition, this can cause serious performance degradation.
23/05/08 12:58:11 WARN WindowExec: No Partition Defined for Window operation! Moving all data to a single partition, this can cause serious performance degradation.
23/05/08 12:58:11 WARN WindowExec: No Partition Defined for Window operation! Moving all data to a single partition, this can cause serious performance degradation.
23/05/08 12:58:11 WARN WindowExec: No Partition Defined for Window operation! Moving all data to a single partition, this can cause serious performance degradation.
23/05/08 12:58:11 WARN WindowExec: No Partition Defined for Window operation! Moving all data to a single partition, this can cause serious performance degradation.
23/05/08 12:58:11 WARN WindowExec: No Partition Defined for Window operation! Moving all data to a single partition, this can cause serious performance degradation.
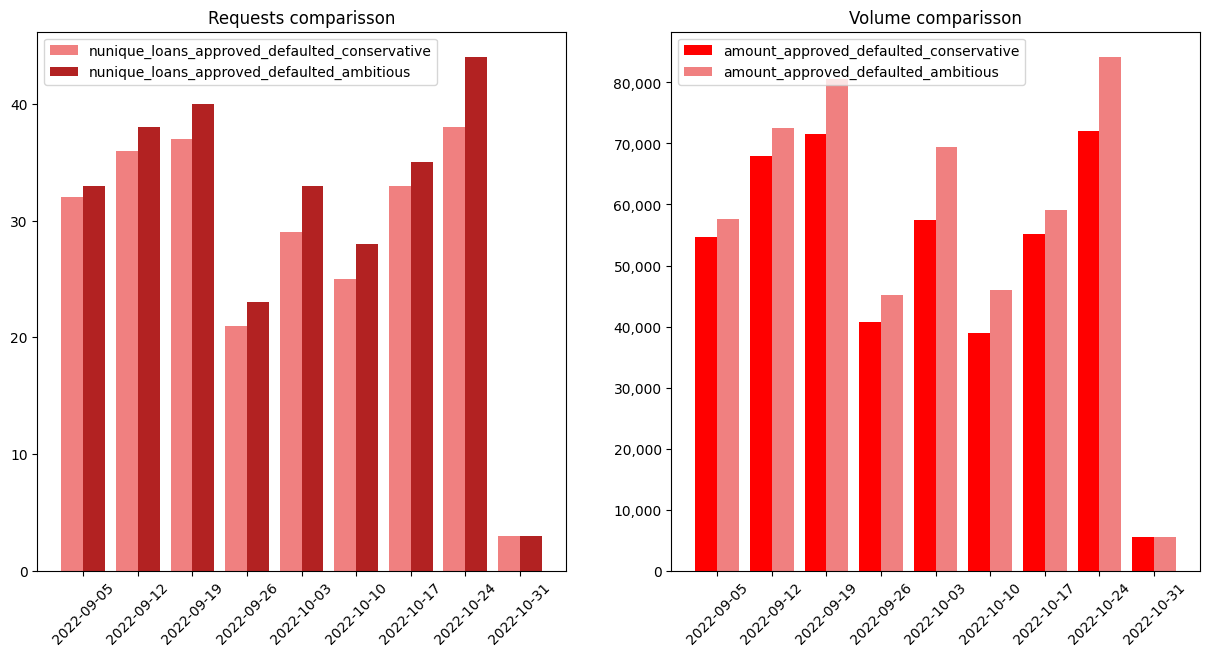
11.6. Conservative vs Ambitious#
fig, (ax1, ax2) = plt.subplots(nrows=1, ncols=2, figsize=(15, 7))
bar_width = .4
x_values = np.arange(len(ambitious_plot_data.index))

ax1.bar(
    # ambitious_plot_data.index,
    x_values - bar_width / 2,
    conservative_plot_data["nunique_loans_approved_defaulted"].values,
    color="lightcoral",
    label="nunique_loans_approved_defaulted_conservative",
    width=bar_width
)
ax1.bar(
    # ambitious_plot_data.index,
    x_values + bar_width / 2,
    ambitious_plot_data["nunique_loans_approved_defaulted"].values,
    color="firebrick",
    label="nunique_loans_approved_defaulted_ambitious",
    width=bar_width
)

ax1.set_title("Requests comparisson")
ax1.set_xticks(x_values)
ax1.set_xticklabels(ambitious_plot_data.index.map(lambda x: str(x).split(" ")[0]), rotation=45)
ax1.yaxis.set_major_formatter(FuncFormatter(lambda x, _: '{:,.0f}'.format(x)))
ax1.legend()

ax2.bar(
    # ambitious_plot_data.index,
    x_values - bar_width / 2,
    conservative_plot_data["amount_approved_defaulted"].values,
    color="red",
    label="amount_approved_defaulted_conservative",
    width=bar_width
)
ax2.bar(
    # ambitious_plot_data.index,
    x_values + bar_width / 2,
    ambitious_plot_data["amount_approved_defaulted"].values,
    color="lightcoral",
    label="amount_approved_defaulted_ambitious",
    width=bar_width
)

ax2.set_title("Volume comparisson")
ax2.set_xticks(x_values)
ax2.yaxis.set_major_formatter(FuncFormatter(lambda x, _: '{:,.0f}'.format(x)))
ax2.set_xticklabels(ambitious_plot_data.index.map(lambda x: str(x).split(" ")[0]), rotation=45)
ax2.legend()

plt.show()